Wondering what is a candlestick pattern and how does it apply to your trading?
With the rise of AI in trading, the industry is changing forever, so learning how to read candlestick patterns is essential to any beginner that is just getting into trading.
Knowing what a candlestick pattern represents helps you forecast potential market movements, without conducting exceptional research. It’s a method for the market to “communicate” with the trader and with hundreds of different patterns out there, there is much to learn!
So, let’s start with a brief overview of what candlestick patterns are!

What is a Candlestick Pattern & How Does it Work?
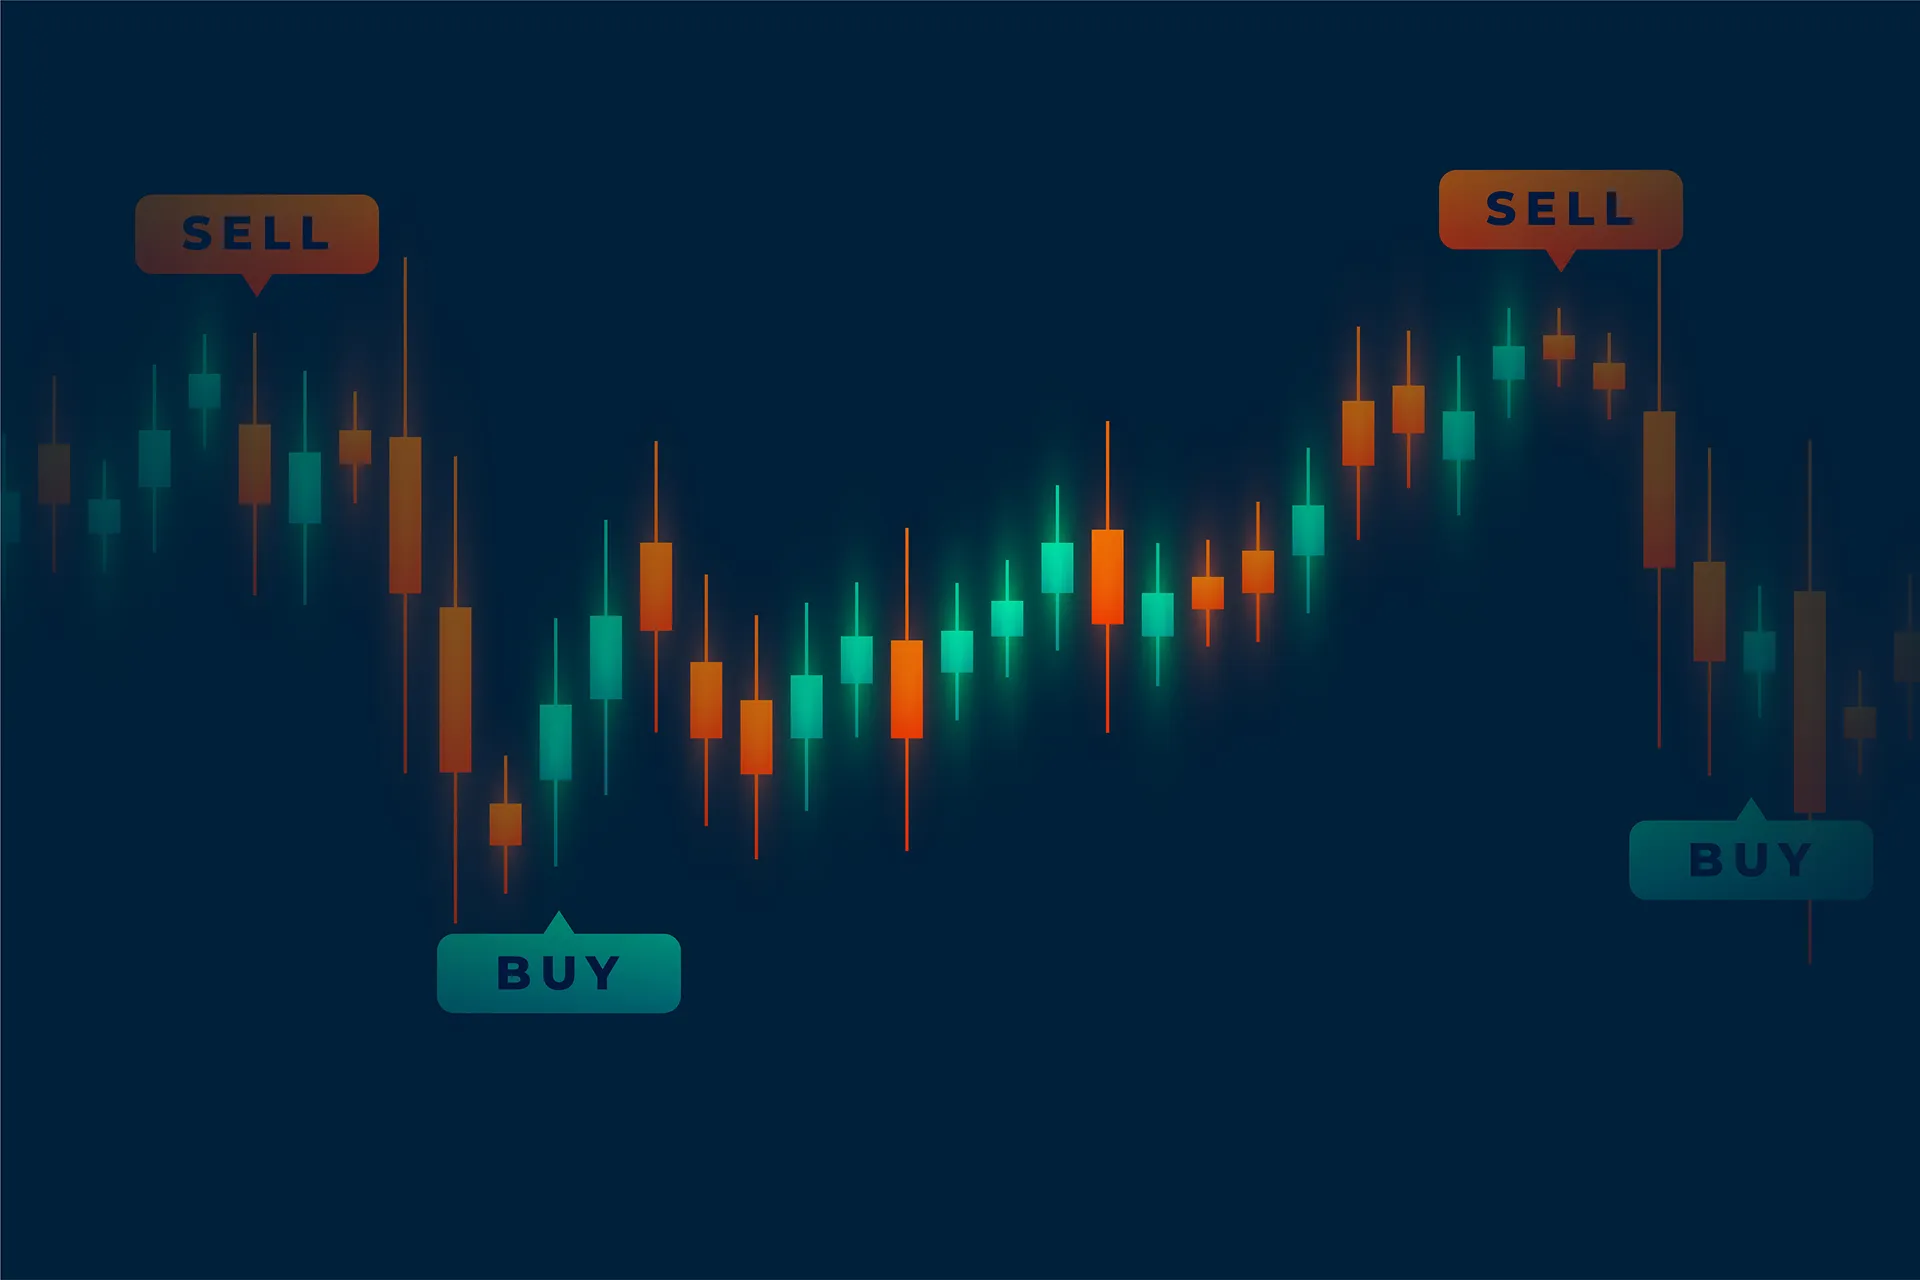
The color of the candlestick during a specified time period in the market is used as an indication of market direction. A candlestick is said to be bullish, that is green or white in color when the closing price is above the opening price. Candlestick is bearish, that is red or black, when the closing price is less than the opening price.
A standard candlestick pattern has four different price values:
- Open: Opening price at the beginning period of time.
- High: Highest price during a period of time.
- Low: Lowest price during a period of time.
- Close: Closing price at the end of a period.
Candlestick Pattern Overview:
- The use of candlestick patterns enables a trader to make price motion predictions with the utilization of information from the past.
- Numerous patterns with specific shapes, each representing a variety of marketplace situations exist.
- The use of such pattern types must accompany other technical markers for optimal performance.
- The use of candlesticks reveals past price action and not future trends.
How to Read Candlestick Patterns
Knowledge of how to read candlestick patterns is essential for a trader. The body, wick, and relationship between candles tell a lot about the direction in the marketplace. Reversal, continuation, and indecision in the marketplace can be revealed through candlestick patterns.
Variety of Candles in Different Markets
Different candles occur in different markets. In forex, trading occurs 24 hours a day, and trading thus ends less frequently at session closures, and price gaps in forex trading will thus occur less frequently compared to trading in stocks and the future, when trading ends at session closures. Conventional gap-based candlestick patterns will thus not occur in forex candles with high frequency.
The Most Common Candle Formations
Now, let’s review the most common candlestick formations of the market!
Doji and Spinning Top
A Doji is when opening and closing prices are nearly the same, indicating indecision in the marketplace. The spinning top is the main factor for distinguishing this pattern. It indicates a balanced buying and selling, and a directional move will follow soon.
Hammer and Hanging Man
A hammer indicates a reversal of a downtrend. It has a thin body and long wick at the base, which indicates that sellers have fought a lot in pushing prices downward but have been overpowered in the end by buyers.
Reversal will be confirmed when a bullish candle appears in its wake. The hanging man is the reverse of a hammer and forms in an uptrend direction. It is a long wick and a small upper body, representing growing selling pressure and a future downtrend in store.
Abandoned Baby Top and Bottom
An abandoned baby is in a strong reversal shape. An abandoned baby top forms in an uptrend and consists of a gap higher, a small candle, and then a gap lower, representing a potential move down. An abandoned baby bottom forms in a downtrend, representing a potential move up.
What Long Wicks and Short-Bodied Candles Mean?
Long-wick and short-bodied candles represent indecision in the marketplace and future impending reversals. Short-bodied candles can represent buyers and sellers fighting for direction, and a break in one direction will follow in many cases. Long wicks represent failed attempts at moving prices in one direction, supporting observation for follow-on price behavior for confirmation.
What Candle Form Has High Relevance?
Although many candle forms, many of them, have high relevance in terms of past performance in predicting direction in the marketplace. Engulfing and bullish and bearish, doji, abandoned baby, and hammer and hanging man are checked regularly for high-probability success for many investors.
Does Analysis of Form Have Value?
Candlestick analysis is universally applicable and can work when performed in proper form. In many cases, it is wise to wait for confirmation in terms of entering a position in a security. Many use a combination of candle forms and additional tools, including moving averages, RSI, and trendlines, for high accuracy.
How to Analyze a Correct Candlestick Form?
To effectively analyze a candle form, a proper analysis must:
- (Important) Identify whether the pattern is bullish, bearish, or neutral.
- Wait for confirmation in the following candle.
- Avoid a simple setup being misinterpreted.
- Corroborate with other technical indications.
Market Mood Via Candlestick Patterns
Not only will price actions be indicated with candlestick patterns, but they also expose the trader’s emotions and sentiment, too. With a strong bullish bias, big green candles will appear, with high demand for purchasing exhibited.
With a strong bearish bias, big red candles will appear, with high demand for sales exhibited. Doji and spinning top forms can even expose uncertainty between buyers and sellers, forecasting an impending reversal in trends. Identification of such moods will allow for forecasting future trends and altering strategies in preparation for them.
Combining Candlestick Patterns with a Trading Strategy
Whereas candlestick indications can make useful indications, they function best in association with a range of additional trading methods.
For example, candlestick indications can be paired with moving averages for confirming trends, with areas of support and resistance for confirming turns, and with momentum tools such as the Relative Strength Index (RSI) or Moving Average Convergence Divergence (MACD) for pinpointing ideal entrances and exits.
By combining candlestick analysis with a composite tool, a trader can maximize their chance of entering profitable deals.
Conclusion:
The use of candlestick patterns can act as an effective forecaster of future marketplace activity, but best when added with other indications. By careful observation of such a pattern and putting it in a larger trading picture, you will not only learn what is a candlestick pattern and how it works but also become a wiser and more effective marketplace participant.